Check This Overlooked Setting to Troubleshoot ‘Strange’ Microsoft SQL Server Performance Issues
As a SQL DBA or a system admin of highly transactional, performance demanding SQL databases, you may often find yourself perplexed by “strange” performance issues reported by your user base. By strange, I mean any issue where you are out of ideas, having exhausted standard troubleshooting tactics and when spending money on all-flash storage is just not in the budget.
Working under pressure from customers or clients to resolve performance issues is not easy, especially when C-Level, sales and end users are breathing down your neck to solve the problem immediately. Contrary to popular belief from many end users, we all know that these types of issues are not resolved with a magic button or the flip of a switch.
But what if there was a solution that came close?
Let’s review the typical troubleshooting process, and an often-overlooked setting that may just be your new “magic button” for resolving unusual SQL server performance issues.
Resolving SQL Server Performance Issues: The Typical Process
Personally, I find troubleshooting SQL related performance issues very interesting. In my previous consulting gigs, I participated in many white boarding sessions and troubleshooting engagements as a highly paid last-resort option for many clients. When I dug into their troubleshooting process, I found a familiar set of events happening inside an IT department specific to SQL Server performance issues.
Here are the typical steps:
- Review monitoring tools for CPU, RAM, IO, Blocks and so on
- Start a SQL Profiler to collect possible offending queries and get a live view of the slowness
- Check underlying storage for latency per IO, and possible bottle necks
- Check if anyone else is running any performance intensive processes during production hours
- Find possible offending queries and stop them from executing
- DBAs check their SQL indexes and other settings
When nothing is found from the above process, the finger pointing starts. “It’s the query.” “No, it’s the index.” “It’s the storage.” “Nope. It’s the settings in your SQL server.” And so it goes.
Sound familiar?
An Often-Forgotten Setting to Improve SQL Server Performance
Based on the typical troubleshooting process, IT either implements a solution to prevent identical issues from coming back or hope to fix the issue by adding all flash and other expensive resources. These solutions have their place and are all equally important to consider.
There is, however, an often-forgotten setting that you should check first—the block allocation size of your NTFS partition in the Microsoft Windows Server.
The block allocation setting of the NTFS partition is set at formatting time, which happens very early in the process and is often performed by a sysadmin building the VM or bare metal server well before Microsoft SQL is installed. In my experience, this setting is left as the default (4K) during the server build process and is never looked at again.
Why is 4K a bad setting? A Microsoft SQL page is 8KB in size. With a 4K block, you are creating two IO operations for every page request. This is a big deal. The Microsoft recommended block size for SQL server is 64K. This way, the page is collected in one IO operation.
In bench tests of highly transactional databases on 64K block allocation in the NTFS partition, I frequently observe improved database performance by as much as 50 percent or more. The more IO intensive your DB is, the more this setting helps. Assuming your SQL server’s drive layout is perfect, for many “strange performance” issues, this setting was the magic button. So, if you are experiencing unexplained performance issues, this simple formatting setting maybe just what you are looking for.
A word of caution: We don’t want to confuse this NTFS block allocation with your underlying storage blocks. This storage should be set to the manufacturer’s recommended block size. For example, as of recently, Nimble storage bock allocation at 8k provided best results with medium and large database sizes. This could change depending on the storage vendor and other factors, so be sure to check this with your storage vendor prior to creating LUNs for SQL servers.
How to Check the NTFS Block Allocation Setting
Here is a simple way to check what block allocation is being used by your Window Server NTFS partition:
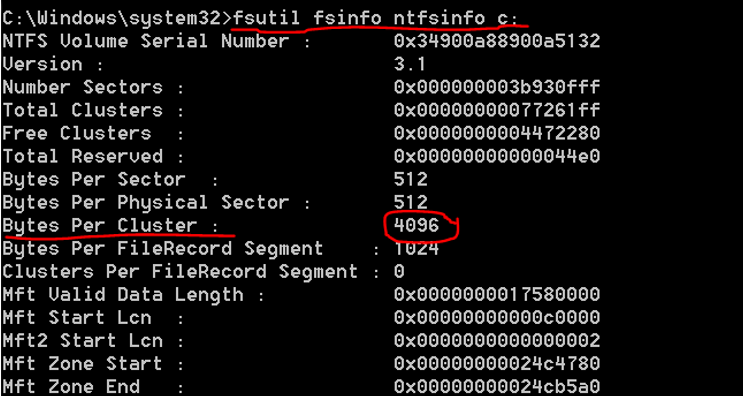
Open the command prompt as administrator and run the following command replacing the C: drive with a drive letter of your database data files. Repeat this step for your drives containing the logs and TempDB files:
- fsutil fsinfo ntfsinfo c:

Look for the reading “Bytes Per Cluster.” If it’s set to 4096, that is the undesirable 4K setting.
The fix is easy but could be time consuming with large database sizes. If you have an AlwaysOn SQL cluster, this can be done with no downtime. If you don’t have an AlwaysOn MSSQL cluster, then a downtime window will be required. Or, perhaps it’s time to build an AlwaysOn SQL cluster and kill two birds with one stone.
To address the issue, you will want to re-format the disks containing SQL data with 64K blocks.
Concluding Thoughts
If your NTFS block setting is at 4K right now, moving the DB files to 64K formatted disks will immediately improve performance. Don’t wait to check into this one.


